2022: Volume 2, Issue 1
Past Issues
 Abstract
  PDF
PDFLC-OCT Imaging for Studying the Variation of Morphological Properties of Human Skin In Vivo According to Age and Body area: The Forearm and the Thigh
Meriem Ayadh1,2*, Marie-Angèle Abellan1, Sara Figueiredo2, Mélanie Pedrazzani3, Emmanuel Cohen3, Armelle Bigouret2, Hassan Zahouani1
1Université de Lyon, 36 avenue Guy de Collongue, Ecully, France 2Laboratoires Clarins, 5 Rue Ampère, Pontoise, France 3DAMAE MEDICAL, 14 Rue Sthrau, Paris, France
*Corresponding author: Meriem Ayadh, Université de Lyon École Centrale de Lyon, 36 avenue Guy de Collongue, Ecully, France. Email: [email protected]
Citation: Ayadh M, et al. (2022). LC-OCT Imaging for Studying the Variation of Morphological Properties of Human Skin In Vivo According to Age and Body area: The Forearm and the Thigh. Dermis. 2(1):2.
Received: October 12, 2022 Published: November 9, 2022
Copyright: Ayadh M, et al. © (2022)
ABSTRACT
The interest of in vivo skin imaging is obvious for both dermatology and cosmetology. It allows an in-depth view of the skin and consequently of the evolution of the tissues. For noninvasive imaging techniques, the two important parameters are resolution and depth of penetration. In this study, we use Line-field Confocal Optical Coherence Tomography (LC-OCT) imaging. This technique provides two image modes of human skin in vivo with very high spatial resolution: vertical and horizontal section images. Thanks to the two modalities of LCOCT, it is possible to obtain full 3D images of the skin’s volume. From these images, it is possible to characterize, in vivo and with the same acquisition, the variation in the thickness of the skin layers (epidermis and papillary dermis), the length and the amplitude of the dermal-epidermal junction (DEJ), and the density and the diameter of fibers in the papillary dermis according to age and body area, in this case, the forearm and the thigh.
The study was carried out on 42 volunteers representing two age groups: a young group [20–30] years old and an elderly group [45 – 55] years old. The aim of this study was to quantitatively characterize the morphological parameters of human skin in vivo and their variability as a function of age and body area. The quantitative analysis of the skin structure in depth shows the dependence of this structure on both factors: age and body area. The results show that the thickness of the skin layers decreases with age. The thickness of the papillary dermis is related to the density of the fibers it contains, the higher the density of the fibers in the papillary dermis, the thicker it is. The dermal-epidermal junction tends to flatten out with aging, especially for the forearm. These results could provide a better understanding of the mechanical properties of the skin and establish new models of reconstructed skin by taking into account the variability of the skin according to the body area and the age of the person.
Keywords: LC-OCT in vivo imaging, dermal-epidermal junction, epidermis, papillary dermis, collagen and elastin fibers
INTRODUCTION
Human skin has a stratified and very complex structure which induces associated mechanical, biochemical, and optical properties that change with age [1]. The cutaneous structure can provide information on the skin’s anatomy, functionality, and properties [1]. The study and characterization of skin layers can be a means of assessing the aging effect, or the application of a medical or cosmetic product [2,3]. Each layer of the skin has different components and therefore specific optical properties. Hence the optical properties of the skin allow distinguishing its various components using imaging techniques. These imaging techniques also give access to the composition of the tissue at the layer scale [4,5]. The interest of in vivo skin imaging is obvious for both dermatology and cosmetology. It allows an in-depth view of the skin, and consequently, it is possible to monitor the evolution of the tissues. The total thickness of the skin varies from 0.5 to 5 mm, depending on its location on the body [1] with a very small distance existing between two components. The physiology of the skin, therefore, requires two important parameters in the imaging techniques used: resolution and depth of penetration. If the resolution is not sufficient, the information is inaccessible. The resolution limit of certain techniques is the reason why it is impossible to obtain information on skin components such as the dermal-epidermal junction or collagen and elastin fibers.
Several techniques for skin characterization by imaging have been developed. These techniques include magnetic resonance imaging (MRI) [6], ultrasound [1], optical coherence tomography (OCT) [7], and confocal microscopy [8]. MRI provides information on the chemical composition of the skin and provides good contrast between its different layers [9]. However, this technique is expensive and the penetration depth is high compared to the skin thickness. It therefore does not provide very good resolution for the first skin layers. Ultrasound is a non-invasive technique which uses ultrasonic waves that reflect inside the body on the various tissues present in their path [10–12]. The echoes thus generated make it possible, in return, to reconstruct an image in the vertical plane perpendicular to the outer surface of the skin with a depth of up to 12 mm. This technique provides information on the thicknesses of the different skin layers down to the hypodermis. However, the resolution is not sufficient to precisely characterize skin components such as the dermal-epidermal junction and the dermal fibers. OCT is based on the principle of interference between the beams of the device, which makes it possible to calculate the reflection distance of the beam entering the skin. This principle is similar to that of the B-mode ultrasound. This technique is well known in ophthalmology to examine the state of the retina layers in depth [13,14]. In particular, it allows to observe any abnormalities or deterioration of the eye [15]. OCT is also used in dermatology in the diagnosis of skin pathologies. The penetration of OCT is about 2 mm and its resolution varies from 1 to 15μm [7,16,17]. OCT allows image acquisition in twodimensional cross sections. It makes it possible to differentiate the three layers of the skin with good resolution: the stratum corneum, the viable epidermis and the dermis, but the depth of penetration remains very limited. Confocal microscopy uses a laser beam in the near infrared (830 nm) [8,18–21]. The laser penetrates the skin and is then reflected by the skin tissue. Only light reflected from the focal region is detected. The contrast in the images is based on the difference in the refractive indices of the tissues, which depend on their respective chemical and molecular structures. Variations in the refractive index of tissue microstructures provide images with contrast. Confocal images are of two types: mosaic images which allow, at a given depth, exploring large surfaces (up to 8 mm2) by juxtaposing images taken in the same focal plane; and stacks of images that allow the three-dimensional exploration of the skin down to the papillary dermis by stacking images taken at regular distances from the surface downwards. However, the imaging depth is limited to 200-300 μm. Higher laser power could provide deeper imaging with higher contrast but would be harmful to the skin and eyes. All these techniques use different resolutions and penetrations which do not allow obtaining information on the different layers of the skin and its components at the same time. Moreover, this information is only available in a given plane: either in the plane parallel to the outer surface of the skin, or in the plane perpendicular to it.
In this study we work with Line-field Confocal Optical Coherence Tomography (LC-OCT) imaging. This innovative technique is used to obtain images of human skin in vivo with very high spatial resolution in the vertical and the horizontal planes at the same time. The aim of this study was to quantitatively characterize the morphological parameters of human skin in vivo and their variability as a function of age and body area. The tests were performed on 42 volunteers of different ages and on two body areas: the forearm and the thigh. Based on these tests, we propose to characterize, in vivo, the variation in the thickness of the skin layers, the length and the amplitude of the dermal-epidermal junction (DEJ), and the density of the papillary dermis fiber network, according to age and body area. Statistical analyses were performed on the experimental data.
MATERIAL AND METHODS
Test zones and panel
The in vivo tests were performed on the right forearm (12 cm above the wrist) and the left thigh (12 cm above the knee) (Figure 1) of 42 Caucasian French women volunteers divided into two groups: a young group of [20-30] years old (21 volunteers) and an elderly group of [45-55] years old (21 volunteers). All the volunteers participated after giving their informed consent and all the procedures conformed to the latest revision of the Declaration of Helsinki. The volunteers were non-smokers, in good health and had healthy skin on the forearm and thigh, without scars or tattoos. To ensure the homogeneity of the measurements, the volunteers had a Body Mass Index (BMI) between 18.5 and 27 kg/m², a cellulite index of less than 2 for the thigh [22], and a phototype between I and III. The volunteers did not apply any cosmetic products on their bodies on the test day. After an acclimatization period of at least 10 minutes the tests were carried out in an air-conditioned room (T = 21 ± 2 °C and H = 50 ± 10%). Each volunteer sat in an armchair (dentist type), her legs extended, uncrossed, and slightly bent, and her right arm resting on an armrest, the palm of her hand facing upwards. The volunteer was asked not to move for the duration of the measurements to ensure their homogeneity and to prevent noise in the recorded data as much as possible.
(a).jpg) (b)
(b).jpg)
Figure 1: Acquisition of images in vivo by LC-OCT of the skin on (a) the forearm (12 cm above the wrist) and (a) the thigh (12 cm above the knee)
Line-field Confocal Optical Coherence Tomography imaging (LC-OCT)
The skin structure was studied by LC-OCT imaging (prototype version, DAMAE, France), a recently developed imaging technique that produces images of human skin in vivo with very high resolution [23]. The LC-OCT technique combines two imaging modes which provide vertical section images (B-scan) of the planes orthogonal to the outer surface of the skin and horizontal section images (C-scan) of the planes parallel to the outer surface of the skin (Figure 2). C-scan imaging is obtained using a mirror galvanometer for side scanning with a piezoelectric chip to modulate the interferometric signal. An almost identical spatial resolution of ∼ 2 µm is measured for B-scans and C-scans [23]. Images are acquired in both modes at a rate of 10 images per second. The horizontal field of view of C-scans is 1.2 × 0.9 mm², and the vertical field of view of B-scans is 1.2 × 0.4 mm². It should be underlined that the probe used here for the acquisition of LC-OCT images performed on the right forearm and on the left thigh (Figure 1 (a and b)) operates at a very small-scale, equivalent to the in vivo cell-scale of the human skin. The resolution of LC-OCT makes it possible to analyze the in vivo cells of human skin in B-scan and C-scan modes. Furthermore, the acquisition rate allows real-time navigation into the soft tissues of in vivo skin at the cell-scale level. These two modes were combined and their potentials exploited to reconstruct a stack of three-dimensional images of the volume of the soft tissues of the skin at the cell-scale level.
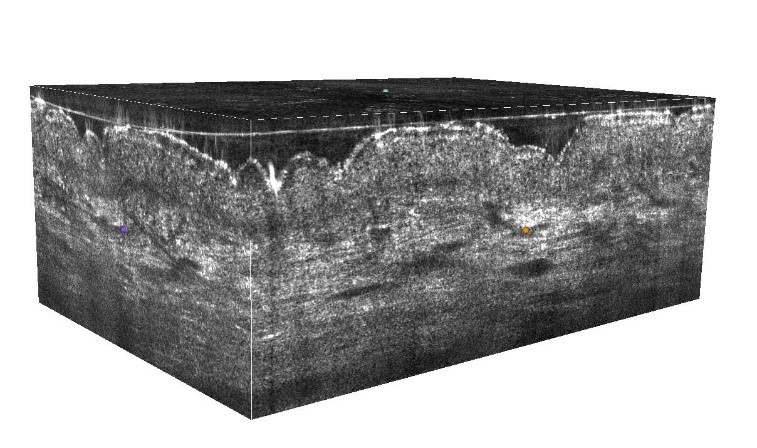
Figure 2: Stack of three-dimensional LC-OCT images
Using the images in the vertical plane perpendicular to the outer surface of the skin, the thicknesses of the epidermis and the length and the amplitude of the dermal-epidermal junction are obtained by segmentation (Figure 3 (a)). The thickness of the papillary dermis is quantified by analyzing the LC-OCT intensity profile as a function of skin depth on the 3D stacks (Figure 3 (b)). The thickness of the papillary dermis is therefore estimated from the width of the corresponding peak of the reflectance of the papillary dermis, as shown in Figure 3 (b). The density (the amount of fiber in the volume) and the diameter of fibers is determined by segmenting the fibers from the images in the horizontal plane parallel to the outer surface of the skin and creating a skeleton (Figure 3 (c)). The calculation of the density and the diameter of the fibers is carried out at 20 μm under the DEJ.
(a).png)
(b).png)
(c).png)
Figure 3: (a) Segmentation of skin layers and DEJ. (b) The LC-OCT intensity profile as a function of skin depth on the 3D stacks. (c) Segmentation of the fibers and creation of a skeleton
Statistical analysis
Statistical analysis was performed using the XLStat software (version 2019.4.2, Addinsoft, France). In this study, the data does not follow a normal law. Thus, the Mann-Whitney nonparametric test was performed with a significance level of 5% to assess the significance of the differences observed between the two age groups (young and elderly) and body areas (forearm and thigh). A Spearman correlation test was carried out to assess the links between the data. This test provided a correlation coefficient (r), i.e., the Spearman coefficient. It is between -1 and 1: if 0.3 < r < 0.5 (or -0.5 < r < -0.3) then the relationship is weak, if 0.5 < r < 0.8 (or -0.8 < r < -0.5) then the relationship is of medium intensity, and if r > 0.8 (or r < -0.8) then the relation is strong. In this study, only coefficients whose associated p-value is significant (< 5%) are interpreted.
RESULTS
Thickness of skin layers
The images in Figure 4 show an example of the images acquired with transverse sections of the skin of the forearm and the thigh of a young volunteer and an elderly volunteer. Figure 5 presents the thicknesses of the epidermis and the papillary dermis extracted from these images according to age and body areas.
The results show that the thickness of the epidermis of the thigh is significantly thicker by +11% than that of the forearm whatever the age group (e thigh, young = 85.9 ± 10.5 μm, e forearm, young = 77.4 ± 10.1 μm, e thigh, elderly = 80.5 ± 6.4 μm, e forearm, elderly = 68.4 ± 10.7 μm). For both areas (forearm and thigh), the thickness of the epidermis in the young group is significantly thicker than the thickness in the older group. However, the percentage is clearly different between the two areas. The epidermis of the forearm of the young group is thicker by +10 % compared to that of the older group, while for the thigh the percentage is only +7 %.
The thickness of the papillary dermis extracted for each age group and for the two body areas show that, for the forearm, the thickness in the young group is significantly thicker than the thickness in the old group by +41 % (e forearm, young = 162.3 ± 33.3 μm, e forearm, elderly = 98.8 ± 26.9 μm). For the thigh, the thickness of the papillary dermis tends to decrease with age (p-value = 0.072) (e thigh, young = 131.4 ± 32.9 μm, e thigh, elderly = 105.5 ± 31.1μm), it is thicker in the young group by +20 %. The difference in thickness of the papillary dermis between the forearm and the thigh is not significant for the elderly group, while for the young group the papillary dermis is significantly thicker for the forearm than for the thigh by +27 % (p-value = 0.003).
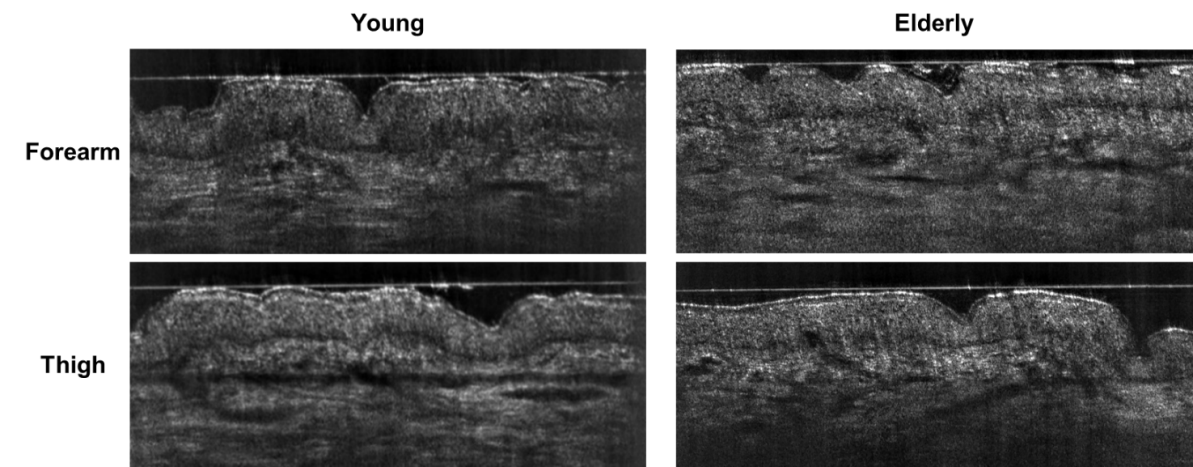
Figure 4: Vertical images taken by LC-OCT of the skin of the forearm and the thigh for a young volunteer and an elderly volunteer. These images clearly illustrate the difference between the two areas of the body in terms of the thickness of the layers. For the young volunteer, the epidermis seems thicker than for the elderly volunteer. Differences are also perceptible in the papillary dermis: the fiber network of the young volunteer appears brighter with long fibers than for the older volunteer.
(a).png) (b)
(b).png)
Figure 5: Thickness of skin layers (* for 0.01 < p-value < 0.05, ** for 0.001 < p-value < 0.01, *** for p-value < 0.0001).
Dermal-epidermal junction
The images in Figure 4 show the difference between the two age groups in terms of the length and amplitude of the dermal-epidermal junction. For the young volunteer the DEJ seems less smooth than for the elderly volunteer and the loops look higher and larger. Figure 6 presents the length and the amplitude of the dermal-epidermal junction extracted from the images according to age and body area.
The length of the DEJ was significantly longer for the forearm by +5% than for the thigh for the young group (l forearm, young = 1.45 ± 0.1 mm, l thigh, young = 1.36 ± 0.08 mm). On the contrary, the results show no significant difference between the length of the DEJ for the elderly group between the forearm and the thigh (l forearm, elderly = 1.38 ± 0.09 mm, l thigh, elderly = 1.36 ± 0.07 mm). Whatever the area of the body, the difference in the length of the DEJ between the young group and the elderly group is small and not significant. It should be noted that for the forearm the length of the DEJ tends to decrease with age (p-value = 0.053).
The amplitude of the DEJ is higher for the forearm than the thigh for the young group (A forearm, young = 3.53 ± 2.2 μm, A thigh, young = 2.60 ± 1.09 μm), but for the elderly group the difference between areas is not significant (A forearm, elderly = 2.90 ± 0.9 μm, A thigh, elderly = 3.11 ± 1.1 μm). For the forearm, the amplitude of the DEJ tends to decrease with age (p-value = 0.097).
(a).png) (b)
(b).png)
Figure 6: Length and amplitude of the dermal-epidermal junction (* for 0.01 < p-value < 0.05, ** for 0.001 < p-value < 0.01, *** for p-value < 0.0001).
Fiber density
The images in Figure 7 show an example of the images acquired in the horizontal plane parallel to the outer skin surface of the forearm and the thigh for a young volunteer and an elderly volunteer. Figure 8 presents the density and the diameter of fibers of the papillary dermis extracted from the images according to age and body area.
The fiber density results show that the density of fibers of the thigh is significantly higher than that of the forearm by +15% for the young group (d forearm, young = 46.7 ± 4.9%, d thigh, young = 55.02 ± 3.9%), and by +14% for the elderly group (d forearm, elderly = 46.35 ± 6.3%, d thigh, elderly = 53.49 ± 4.06%).The difference in density of fibers between the age groups (young and elderly) is not significant (p-value > 0.05) whatever the area of the body.
The fiber diameter results show that the fiber diameter at the thigh is significantly greater than that at the forearm by +8% for the young group (Ø thigh, young = 11.2 ± 0.4 μm, Ø forearm, young = 10.4 ± 0.6 μm) and +7% for the older group (Ø thigh, elderly = 11.05 ± 0.5 μm, Ø forearm, elderly = 10.3 ± 0.9 μm). The difference in fiber diameter between age groups (young and old) is small and not significant regardless of body area.
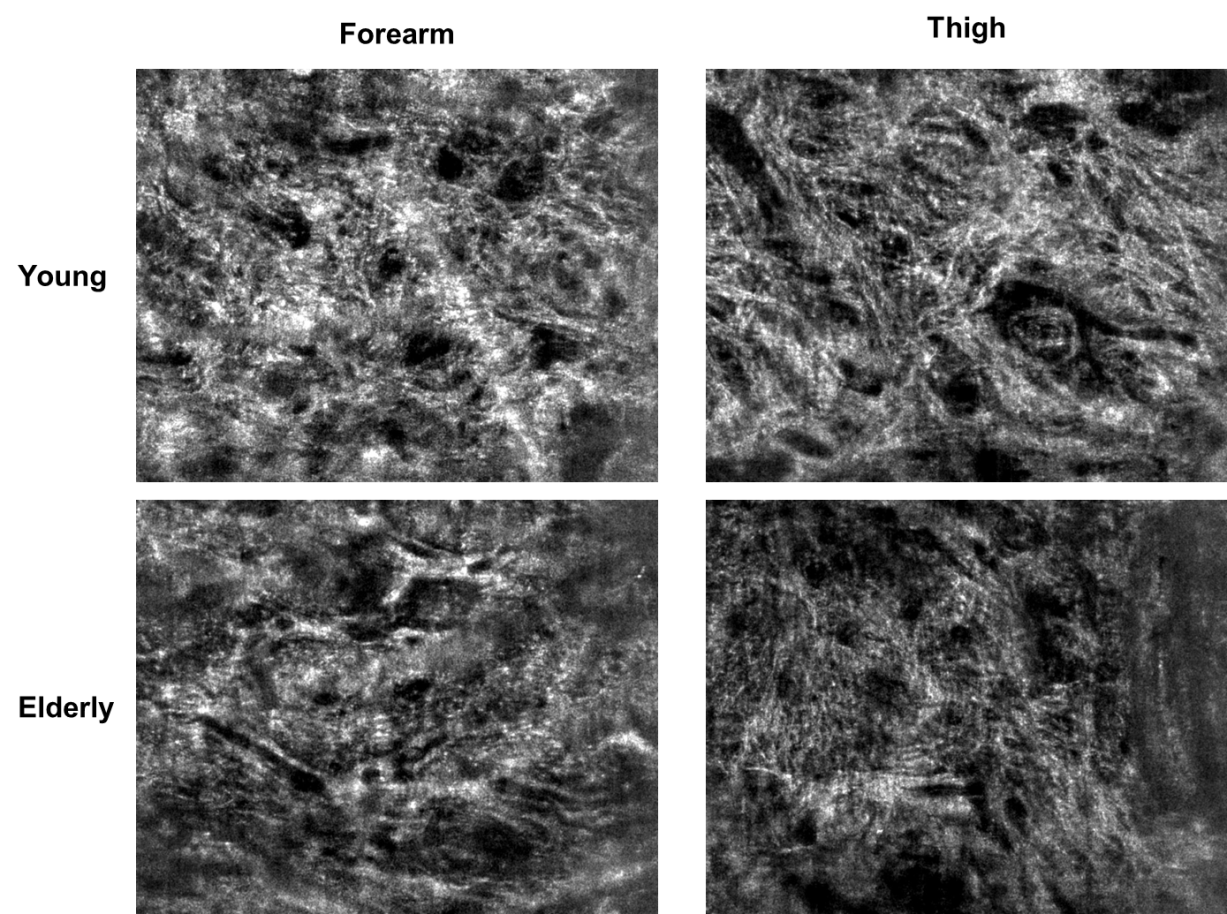
Figure 7: Horizontal images taken by LC-OCT of the skin of the forearm and the thigh for a young volunteer and an elderly volunteer. These images show the state of the fiber network for skin for both body areas. It can be seen that the fibers of the forearm and the thigh are oriented differently. For the young volunteer, the fiber network seems denser than that of the elderly volunteer.
(a).png) (b)
(b).png)
Figure 8: (a) Density of fibers. (b) Diameter of fibers (* for 0.01 < p-value < 0.05, ** for 0.001 < p-value < 0.01, *** for p-value < 0.0001).
Correlation tests
The structure of the skin in terms of the thickness of the layers changes with age. The thicknesses of the epidermis and the papillary dermis decrease with age (rSpearman, = -0.35, rSpearman = -0.63). The thickness of the papillary dermis is also related to the density of the fibers it contains (rSpearman = 0.46), the higher the quantity of fibers in the papillary dermis, the thicker it is. The length of the DEJ increases when the thickness of the papillary dermis is higher (rSpearman = 0.32).
DISCUSSION AND CONCLUSION
Analysis of the skin structure in vivo (using the LC-OCT images) allows quantifying the intrinsic parameters of the human skin which include the thicknesses of the layers of soft skin tissues, the length and the amplitude of the dermal-epidermal junction, and the density of the fibers of the papillary dermis for two areas of the human body: the forearm and the thigh.
The results of this study show points in common and points of difference in the physiology of the skin of the two body areas: the forearm and the thigh. The skin has the same behavior, whether for the forearm or for the thigh, regarding the evolution of its structural properties with age, in particular the thicknesses of the cutaneous layers. The latter decrease in both areas of the body for the two age groups ([20–30] and [45–55] years old). In the literature, the evolution of the thickness of the cutaneous layers differs according to the methods used, the population and the body areas studied [10]. The thicknesses of the skin layers measured from the vertical LC-OCT images (68.4 ± 10.7 < e < 85.9 ± 10.5 μm for the epidermis, 98.8 ± 26.9 < e < 162.3 ± 33.3 μm for the papillary dermis) are consistent with the orders of magnitude found in the literature (from 30 to 80 μm for the epidermis, from 20 to 100 μm for the papillary dermis) [1,10,17,24–26]. In the current study, the thickness of the epidermis decreased by -10% for the forearm and by -7% for the thigh. The thickness of the papillary dermis decreased by -41% for the forearm and by -20% for the thigh. This difference could be related to the fact that the forearm is more exposed to the sun than the thigh, as shown by Waller & al. [10] and Wurm & al. [21].
On the other hand, the skin properties were not the same for the two zones regarding the structure of the layers. The epidermis was thicker for the thigh by +11% than for the forearm whatever the age group. The difference in thickness of the papillary dermis between the forearm and the thigh was particularly marked for the young group; it was thicker for the forearm than the thigh by +27%. To our knowledge, no other studies have compared the thicknesses of the skin layers between the forearm and the thigh.
The difference between the body areas was also remarkable when looking at the length and the amplitude of the dermalepidermal junction, particularly for young skin. The length and the amplitude of the DEJ were greater for the forearm by +5% than the thigh for the young skin. These parameters tended to decrease with age for both zones, with no difference of note between them. The length of the DEJ measured in this study varied between 1.36 ± 0.08 and 1.45 ± 0.1 mm which correspond to the minimum and maximum of the means obtained. These values are consistent with the literature (from 1 to 1.25 mm) [1,27,28]. In the literature, there is a lack of information available concerning the amplitude of the DEJ. In our study, this amplitude varied from 2.60 ± 1.09 to 3.53 ± 2.2 μm (the limits of the interval equal to the minimum and maximum of the means obtained, respectively). These observations mean that the DEJ tends to flatten out with age, as was also shown by Wurm & al. [21]. The loops tend to disappear and to give way to a smooth wavy surface oriented in a plane parallel to the plane of the outer surface.
The density of the fibers extracted from the horizontal LC-OCT images was also different between the forearm and the thigh. The results show that the density of the fibers of the thigh was higher than that of the forearm by +15% for the young group and by +14% for the elderly group. However, no significant differences between age groups were observed. This could be related to the fact that the age difference between the two groups in this study ([20-30] and [45-55] years old) was not sufficient to show significant differences for fiber density. This varied from 46.35 ± 6.3 to 55.02 ± 3.9%, which correspond to the minimum and maximum of the means obtained. The fiber diameter results show that the fiber diameter at the thigh is greater than that at the forearm by +8% for the young group and by +7% for the elderly group. The diameter varied between 10.3 ± 0.9 and 11.2 ± 0.4 μm which were the minimum and maximum of the means obtained. Regardless of body area, the difference in fiber diameter between age groups is small and not significant.
Hence, the LC-OCT images provided information on the structure and components of the skin and made it possible to assess the age effect as well as the particularities of each area of the body. The results of the correlation test highlighted the age effect on the thickness of the skin layers as well as the link between the thickness of the papillary dermis and the quantity of fibers it contains. This allowed us to deduce that the quantity of fibers tends to decrease with age.
This information is of great importance for understanding the overall mechanical response of the human skin to a mechanical external load applied to its outer surface. Mechanically speaking, the additive properties of physical phenomena make it possible to envisage the overall response of the human skin as the sum of the individual response of each layer of soft skin tissues. Furthermore, the overall response of the skin can be partitioned into three phases during which the soft skin tissues attempt to bear external mechanical loads while seeking a new equilibrium or at least coping with it in order to maintain their mechanical integrity without too much damage or cracks.
During the first phase, the applied load is mechanically spread throughout the volume of the human soft skin tissues. Considering the results presented above, let us consider 4 volumes for our analysis: a volume V1 having the averaged dimensions obtained for the young group for the forearm, a volume V2 having the averaged dimensions obtained for the young group for the thigh, a volume V3 for the elderly group for the forearm and a volume V4 for the elderly group for the thigh. Table 1 presents these volumes calculated from the measured thicknesses (epidermis + dermis) and using the dimensions of the LC-OCT images (length of the horizontal image = 120 μm, width of the horizontal image = 90 μm).
Table 1: Averaged volumes
|
Volume (body area, age group) |
Averaged value of the volumes |
|
V1 (forearm, young group) [mm3] |
2.24 × 10⁻³ ± 6.63 × 10⁻⁴ |
|
V2 (thigh, young group) [mm3] |
2.08 × 10⁻³ ± 6.63 × 10⁻⁴ |
|
V3 (forearm, elderly group) [mm3] |
1.25 × 10⁻³ ± 5.96 × 10⁻⁴ |
|
V4 (thigh, elderly group) [mm3] |
1.68 × 10⁻³ ± 6.17 × 10⁻⁴ |
According to the hypothesis that the four volumes are made of the same homogeneous material, it would appear that, mechanically speaking, the bigger the volume the easier it is to bear the external mechanical load applied. In this case, a classification of the volume from the strongest to the weakest appears: V1, V2, V4 and V3. In other words, only the geometrical properties of the volumes show that the young group has a larger skin volume than the elderly group and that for the young group the skin volume of the forearm is larger than that of the thigh. Surprisingly, the results show a totally different behavior for the elderly group. For the latter, the skin volume of the thigh is larger than that of the forearm.
However, it is known that human soft skin tissues are stratified and made of different materials [1,29,30]. Furthermore, references have shown that during the first phase, the 3D elastin fiber network scattered in the papillary dermis in the 2D network (parallel to the plane of the outer surface) of the collagen fibers will be the first to bear an external mechanical load. In a civil engineering sense, the elastin fibers can be seen as springs that spread the load throughout the volume. The density of these springs is higher in the vertical direction orthogonal to the outer skin surface. The relative thickness of each layer is very important in such cases. A thick papillary dermis will host more elastin fibers than a thin one. Again, in this case, the classification of the volume from the largest to the smallest appears to be: V1, V2, V4 and V3.
During the second phase, the collagen fibers of the papillary dermis will reorient themselves to participate in resisting the external mechanical load [31]. The results presented above show that the thick papillary dermis of the young group is associated with a dense fiber network. The young skin has a thick papillary dermis for both zones which contains a large quantity of fibers. The densities of fibers are higher for the thigh (55.02 ± 3.9%) than for the forearm (46.7 ± 4.9%). With high densities, the quantity of fibers able to reorient themselves and participate will be significant. This provides the skin of the young group with a considerable advantage when bearing an external mechanical load. Moreover, it was found that the elderly group had a thin papillary dermis (105.5 ± 31.1μm for the thigh and 98.8 ± 26.9 μm for the forearm) containing a less dense fiber network with densities equal to 53.49 ± 4.06% for the thigh and 46.35 ± 6.3% for the forearm. The elderly group was less well equipped to cope with external mechanical loads.
Finally, during the third phase, the collagen fibers were oriented in the main direction of the external mechanical load applied and they resisted it to maintain the skin volume as safe as possible. Again, a thick papillary dermis with a dense fiber network will be better equipped for such a function. Moreover, it was shown in the study of Ayadh & al. [32] that subjected to a mechanical loading equivalent to an air blow, the overall response of the human skin in vivo exhibits large displacements and that this phenomenon is due to the additive property of the contribution of each layer. Subjected to an external mechanical load, each layer undergoes a large displacement. It can be considered here that when subjected to any other mechanical load (all bigger than an air blow), the soft skin tissues will also undergo large displacements.
If the layers, including the papillary dermis, are healthy and thick, this reveals a healthy fiber network. This thickness should not originate from fat storage. It is corresponds to the skin of the young group. The skin is therefore able to bear mechanical loads in good conditions. On the contrary, if the layers, including the papillary dermis, are healthy but thinner, this corresponds to the skin of the elderly group. The thin layers have a less dense fiber network. These fibers will be less strong globally in the sense that they will be less numerous when bearing an external applied mechanical load. They will provide the skin with a less developed capability to adapt, be flexible and even extensible when bearing an applied external mechanical load. The skin may have difficulties in resisting a load and maintaining its capacity to push-forward (in the case of compression) or push-backward (in the case of extension) in response to an imposed movement, involving the large displacement described in [32]. The skin will appear less elastic, less supple, with a poorer natural tension state. In other words, the results obtained here allow proposing the mechanical interpretation that loss of skin elasticity is caused by the decreasing thickness of the skin layers.
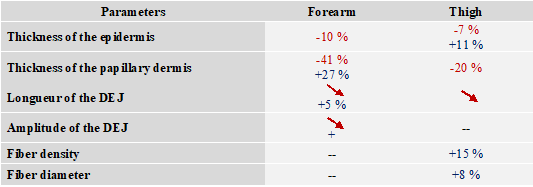
It should be noted that this degradation of the skin’s properties depends on the body area due to the structural particularity of each area of the body (Table 2). This explains why the aging effect is more marked on certain areas of the body than others. All these changes that the physiology of the skin undergoes with age impact its mechanical properties in terms of elasticity, suppleness, and tension [33].
Table 2: Summary of the results (red for evolution according to age, red arrow for qualitative decrease observed, blue for the differences observed for the body areas, -- for no change observed)
REFERENCES
1. Agache P. (2000). Physiologie de la peau et explorations fonctionnelles cutanées. EM INTER.
2. H. Zahouani. (1998). Spectral and 3D motifs identification of anisotropic topographical components. Analysis and filtring of anisotropic patterns by morphological rose approach. Int. J Mach Tools Manuf. 38(1-2): 615-623.
3. Sharif A, Akhtar N, Khan MS, Menaa A, Menaa B, Khan BA, et al. (2015). Formulation and evaluation on human skin of a water-in-oil emulsion containing Muscat hamburg black grape seed extract. Int J Cosmet Sci. 37(2):253-258.
4. Igarashi T, Nishino K, and Nayar SK. (2005). The Appearance of Human Skin. Columbia University. New York. NY 10027. USA.
5. Vo-dinh T. (2003). Biomedical Photonics. Boca Raton London New York Washington DC. CRC PRESS.
6. Tran HV. (2007). Caractérisation des propriétés mécaniques de la peau humaine in vivo via l’IRM. Université de Technologie de Compiègne.
7. Li C, Guan G, Reif R, Huang Z and Wang RK. (2012). Determining elastic properties of skin by measuring surface waves from an impulse mechanical stimulus using phase-sensitive optical coherence tomography. J R Soc Interface. 9(70):831-841.
8. Robic J. (2018). Automated characterization of skin aging using in vivo confocal microscopy. Medical Imaging. Université Paris Est.
9. Tran HV. (2007). Caractérisation des propriétés mécaniques de la peau humaine in vivo via l’IRM. Université de Technologie de Compiègne. Français.
10. Waller JM and Maibach HI. (2005). Age and skin structure and function, a quantitative approach (I): blood flow, pH, thickness, and ultrasound echogenicity. Skin Res Technol. 11(4):221-235.
11. Gniadecka M, Gniadecki R, Serup J, Søndergaard J. (1994). Ultrasound Structure and Digital Image Analysis of the Subepidermal Low Echogenic Band in Aged HUlnan Skin: Diurnal Changes and Interindividual Variability. J Invest Dermatol. 102(3):362-365.
12. Seidenari S, Pagnoni A, Di Nardo A and Giannetti A. (1994). Echographic evaluation with image analysis of normal skin: variations according to age and sex. Skin Pharmacol. 7(4):201-209.
13. Fujimoto JG, Pitris C, Boppart SA and Brezinski ME. (1999). Optical Coherence Tomography : An Emerging Technology for Biomedical Imaging and Optical Biopsy. Neoplasia. 2(1-2):9-25.
14. Bhende M, Shetty S, Parthasarathy MK, and S Ramya. (2018). Optical coherence tomography : A guide to interpretation of common macular diseases. Indian J Ophthalmol. 66(1):20-35.
15. Menaa F, Khan BA, Uzair B and Menaa A. (2017). Sickle cell retinopathy : improving care with a multidisciplinary approach. J Multidiscip Healthc. 10:335-346.
16. Maiti R, Gerhardt LC, Lee ZS, Byers RA, Woods D, SanzHerrera JA, et al. (2016). In vivo measurement of skin surface strain and sub-surface layer deformation induced by natural tissue stretching. J Mech Behav Biomed Mater. 62:556-569.
17. Gambichler T, Matip R, Moussa G, Altmeyer P and Hoffmann K. (2006). In vivo data of epidermal thickness evaluated by optical coherence tomography: Effects of age, gender, skin type, and anatomic site. J Dermatol Sci. 44(3):145-152.
18. Longo C, Casari A, Beretti F, Cesinaro A M and Pellacani G. (2011). Skin aging: In vivo microscopic assessment of epidermal and dermal changes by means of confocal microscopy. J Am Acad Dermatol. 68(3):e73-82.
19. Huzaira M, Rius F, Rajadhyaksha M, Anderson RR and Gonza S. (2001). Topographic Variations in Normal Skin, as Viewed by In Vivo Re¯ectance Confocal Microscopy. J Invest Dermatol. 116(6):846-852.
20. Ghita MA, Caruntu C, AE Rosca, H Kaleshi, ACaruntu, L Moraru, et al. (2016). Reflectance confocal microscopy and dermoscopy for in vivo, non-invasive skin imaging of superficial basal cell carcinoma. Oncol Lett. 11(5):3019- 3024.
21. Wurm EMT, Longo C, Curchin C, Soyer HP, Prow TW, Pellacani G. (2012). In vivo assessment of chronological ageing and photoageing in forearm skin using reflectance confocal microscopy. Br J Dermatol. 167(2):270-279.
22. Hexsel D, Goldman MP. (2010). Cellulite Pathophysiology and Treatment. Second Ed. CRC PRESS.
23. Ogien J, Levecq O, Azimani H, and Dubois A. (2020). Dualmode line-field confocal optical coherence tomography for ultrahigh-resolution vertical and horizontal section imaging of human skin in vivo. Biomed Opt Express. 11(3):1327-1335.
24. Pellacani G and Seidenari S. (1999). Variations in Facial Skin Thickness and Echogenicity with Site and Age. 79(5):366- 369.
25. Van Mulder TJS, de Koeijer M, Theeten H, Willems D, Van Damme P, Demolder M, et al. (2017). High frequency ultrasound to assess skin thickness in healthy adults. Vaccine. 35(14):1810-1815.
26. Shuster SAM, Black MM and EVA Mcvitiet. (1975). The influence of age and sex on skin thickness, skin collagen and density. Br J Dermatol. 93(6):639-643.
27. Boyer G. (2010). Modelisation du comportement mecanique de la peau humaine in vivo : application au vieillissement. École Nationale Supérieure des Mines de Saint-Étienne.
28. Burgeson RE and Christianot AM. (1997). The dermalepidermal junction. Curr Opin Cell Biol. 9(5):651-658.
29. Agache PG, Monneur C, Leveque JL and Rigal J De. (1980). Mechanical properties and Young’s modulus of human skin in vivo. Arch Dermatol Res. 269(3):221-232.
30. Leveque JL, Rigal J de, Agache PG, and Monneur C. (1980). Influence of Ageing on the in Vivo Extensibility of Human Skin at a Low Stress. Arch Dermatol Res. 269(2):127-135.
31. Holzapfel GA. (2000). Biomechanics of soft tissue. J Biomech. 1(1):149-154.
32. Ayadh M, Abellan MA, Bergheau MJ and Zahouani H. (2018). 3D characterization of viscoelastic hydrostatic pressure field in human skin in vivo : numerical contactfree creep tests. Heal Educ Care. 3(1):11-15.
33. Ayadh M, Abellan MA, Didier C, Bigouret A, and Zahouani H. (2020). Methods for characterizing the anisotropic behavior of the human skin’s relief and its mechanical properties in vivo linked to age effects. Surf Topogr Metrol Prop. 8(1):14002.